Getting Started
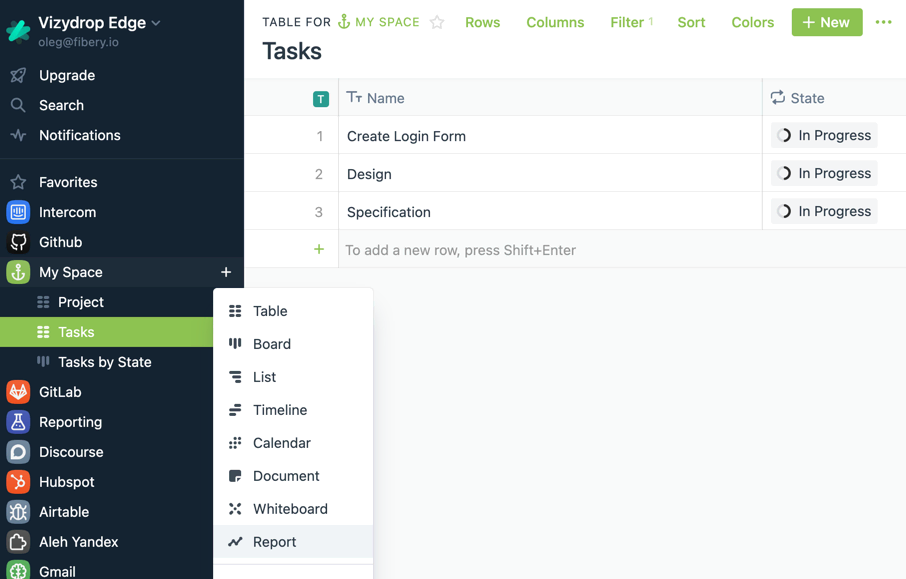
Click "+" near space name and select Report option to start report creation.
It is required to select data source for your report. Fibery can be selected if there is a need to visualize data inside or Trello, Github or other app can be selected to visualize the data from external source. You may select different chart type for visualizing your data: Charts, Pie Chart, Visual Table or Visual Metric.
Modify your visualization using editor and click Finish to save it.
