Annotations
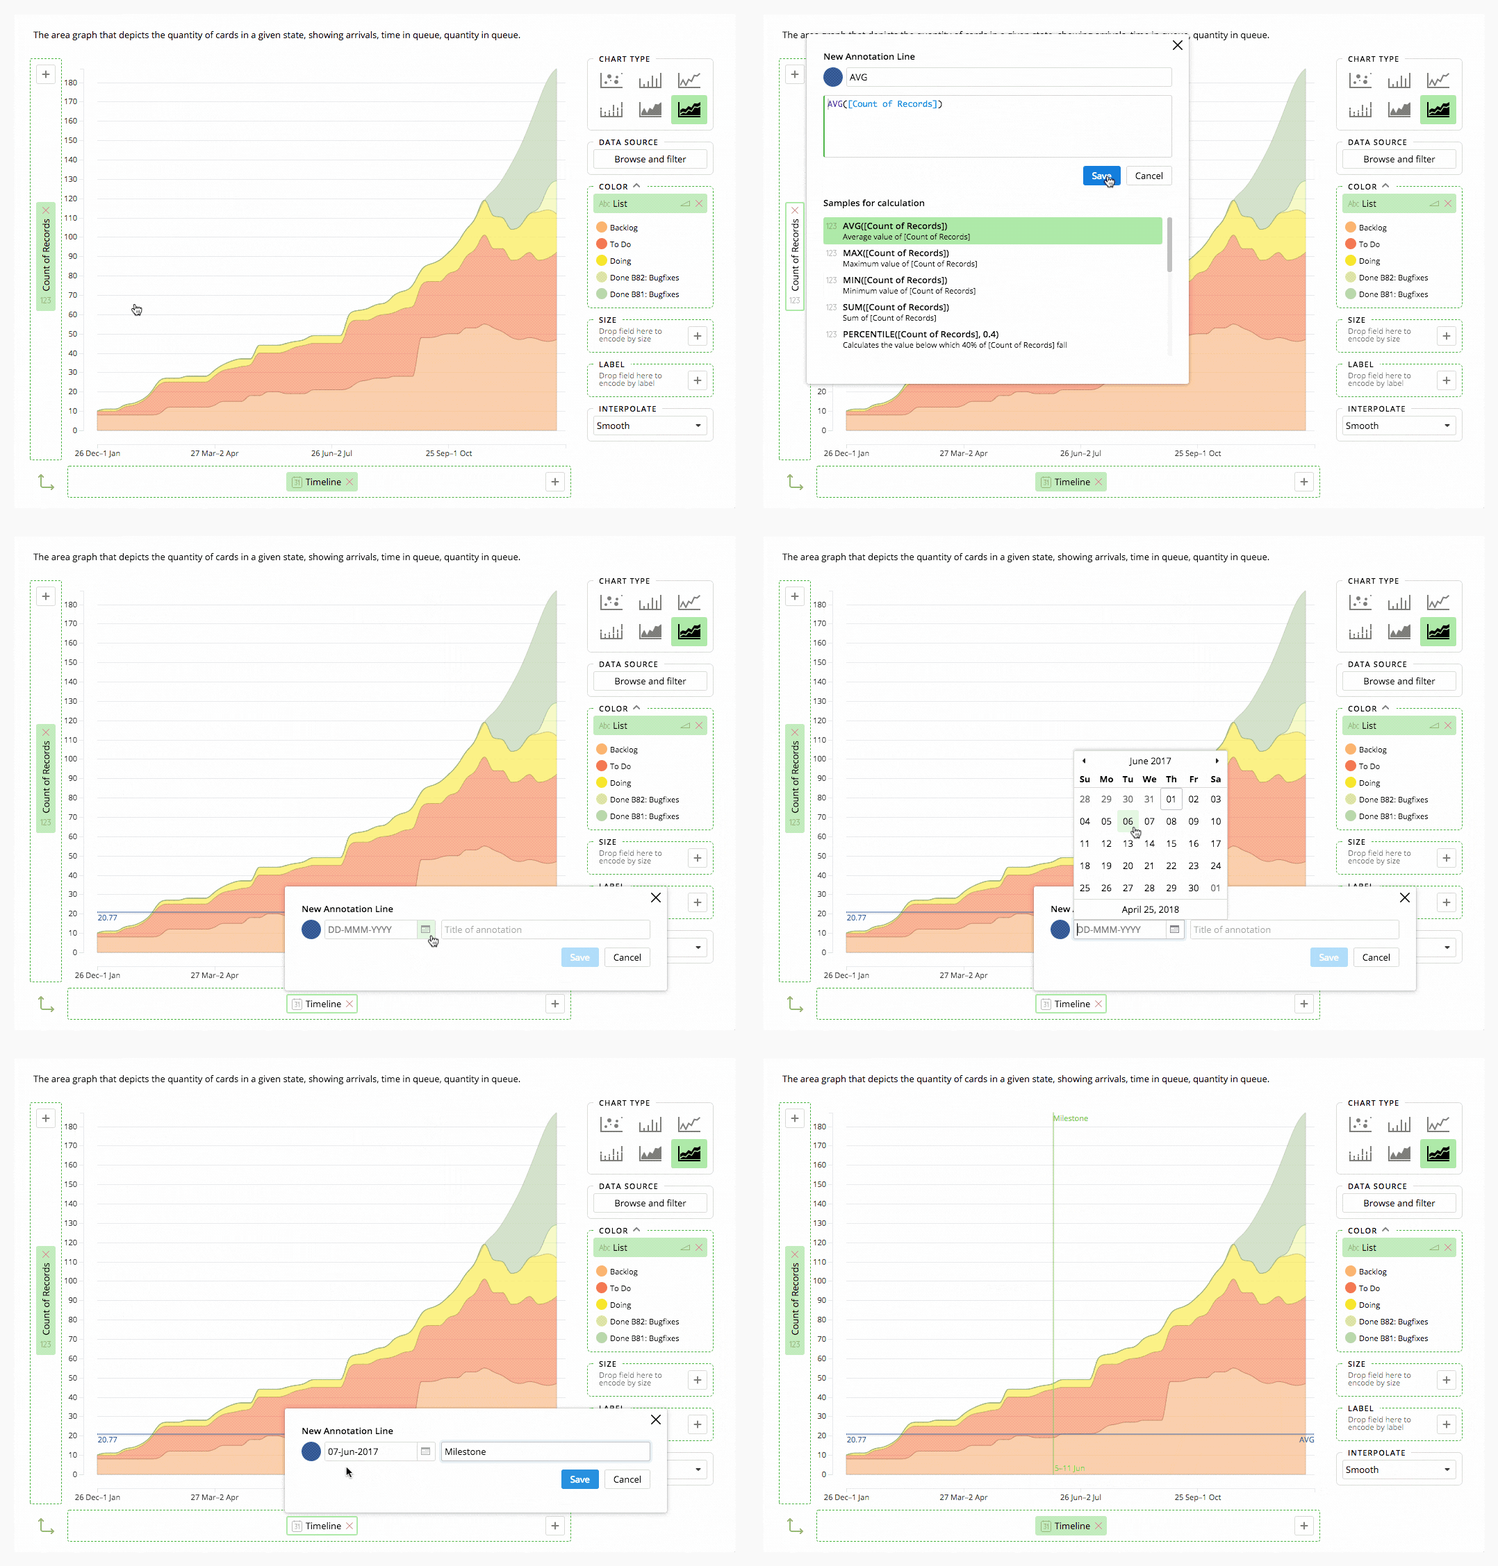
Sometimes you'll need to create milestones or threshold lines. This is possible by creating annotations for dimensions. You can created dynamic or static annotations via the dimension popup. Please see the examples below.

The following math and statistical functions are available for numeric annotations:
Returns the avg of chart numbers
AVG([Sum(Hours Spent)]) + 10
Returns the distinct count of values for provided chart dimension
COUNT_DISTINCT(MONTH([End Date]))
Returns the first value of chart numbers
FIRST([Count Of Records])
Shows the forecast line for defined numerical chart dimension and end
FORECAST_LINE([Count of Records], LAST([Count Of Records]))
Shows the line by defined start and end
IDEAL_LINE(0, LAST([Count Of Records]))
Returns the last value of chart numbers
Returns the max of chart numbers
MAX([Sum(Hours Spent)]) + 10
Returns the median of chart numbers
MEDIAN([Sum(Hours Spent)]) - 5
Returns the min of chart numbers
MIN([Sum(Hours Spent)]) + 10
Returns the value at a given percentile of chart numbers
PERCENTILE([Sum(Hours Spent)], 0.3)
Returns the standard deviation of chart numbers
STDEV([Sum(Hours Spent)])
Returns the total sum of chart numbers
SUM([Count Of Records])/10
Shows the forecast based on custom velocity.
VELOCITY_FORECAST(FIRST([Count Of Records]), 0, 5)
