Calculations
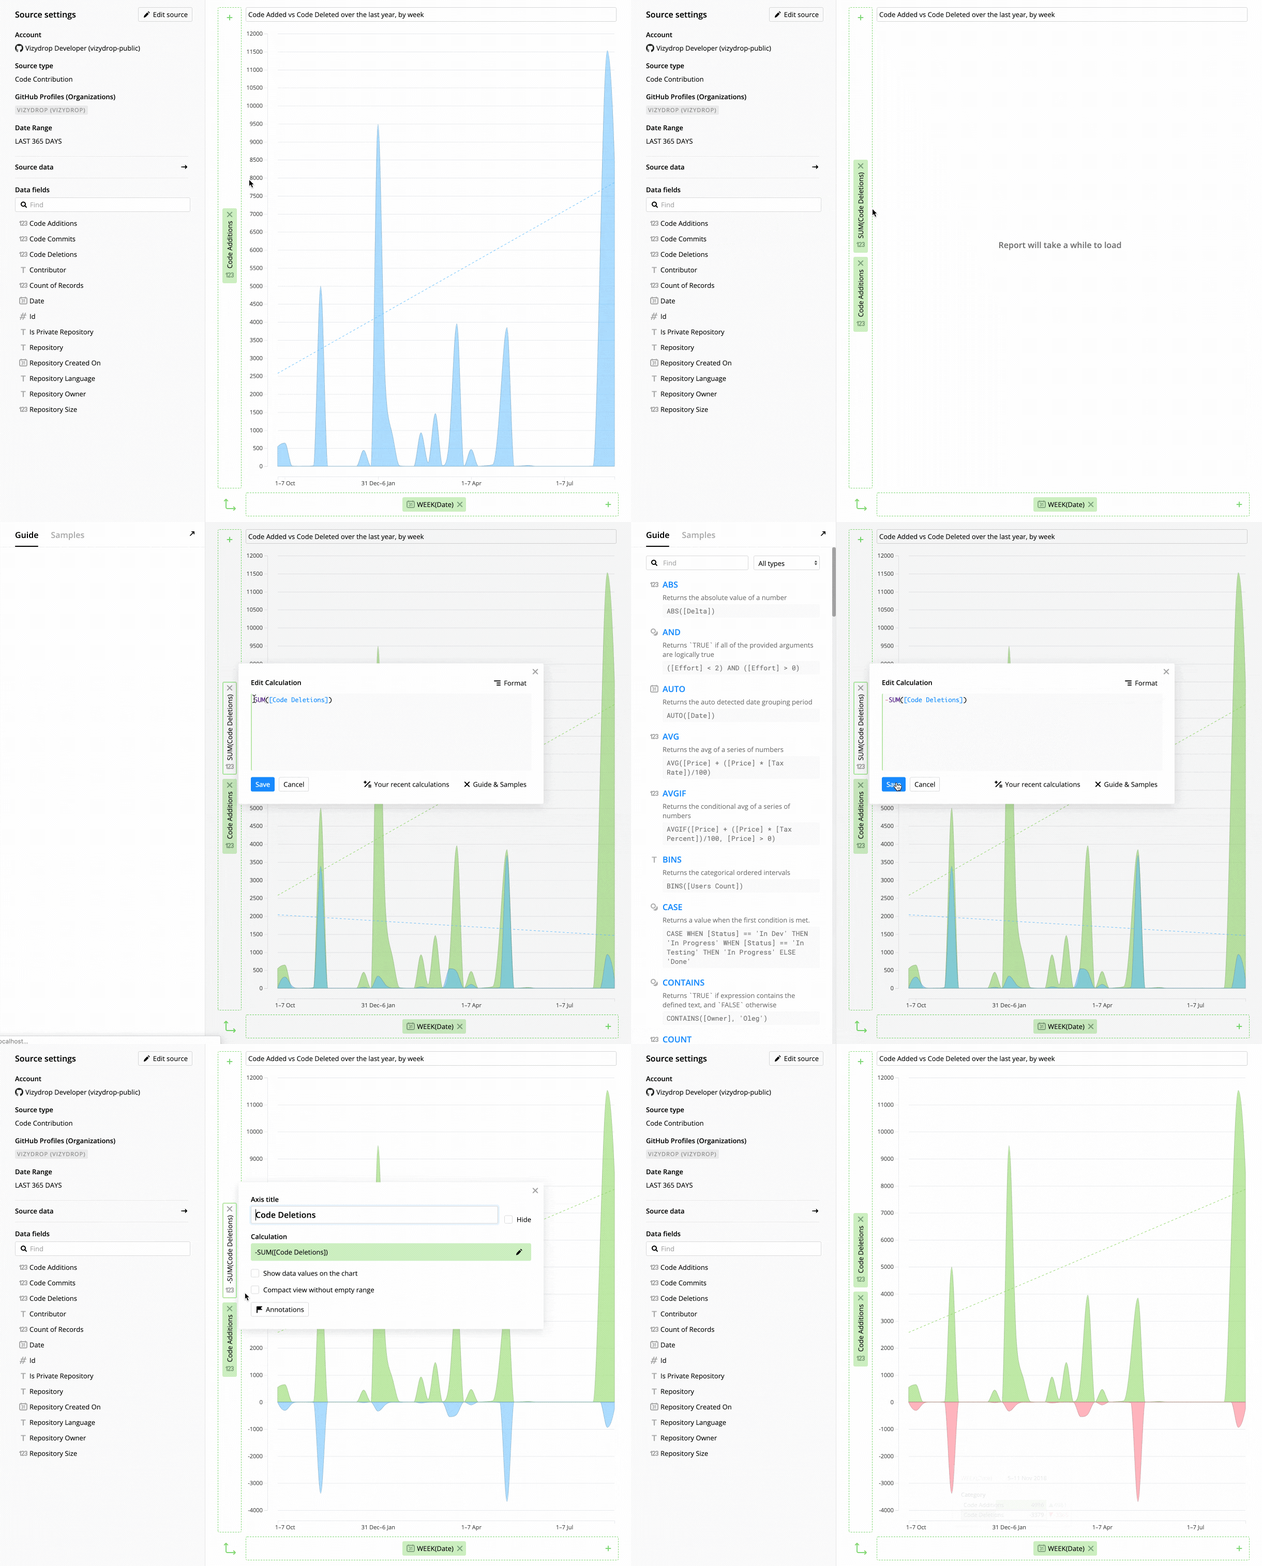
Calculations allow us to use much more powerful techniques for data manipulation. Quite often, configuring a chart will require you to apply some aggregations and post-aggregations to your data field. This can be done using in-chart calculations. Technically every data field which is put into an axis or encoding panel (e.g. color) has a calculation. Some dimension calculations can be created using UI aggregation and grouping buttons, but some can only be created using the calculation text box.
How calculations can be added or edited
New calculations can be added using the "+" sign, or by double-clicking x, y, color, size, or label. The "New Calculation" popup will appear. It utilizes autocomplete and is charged with samples containing almost every available function.
You can find the list of available functions and operators below.
