Date Dimension
Continuous vs Period Scale
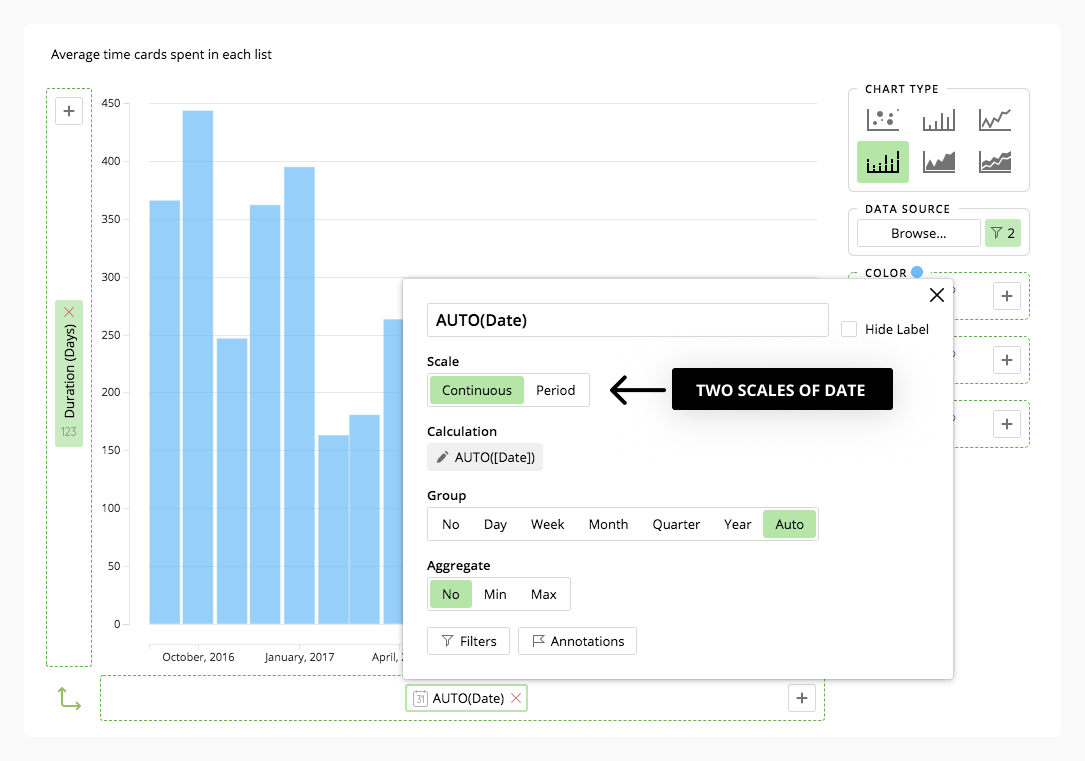
We support two scales of date in Fibery reports: continuous and period. Date scale can be switched in the date dimension.
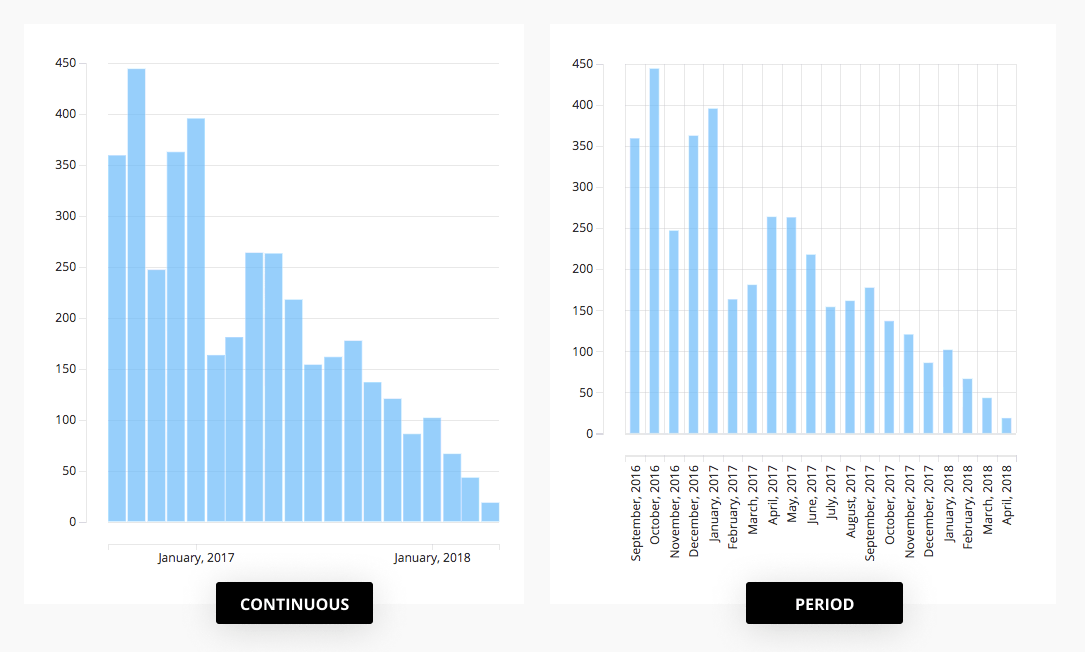
The main difference between these date scales is how they are rendered on plots, and how the value of axes in the scale are treated. Values on a period scale are treated as ordered unique categories, while the continuous scale is treated like a linear scale. See our example below on how the same data can be represented using different date scales.
Grouping data by date
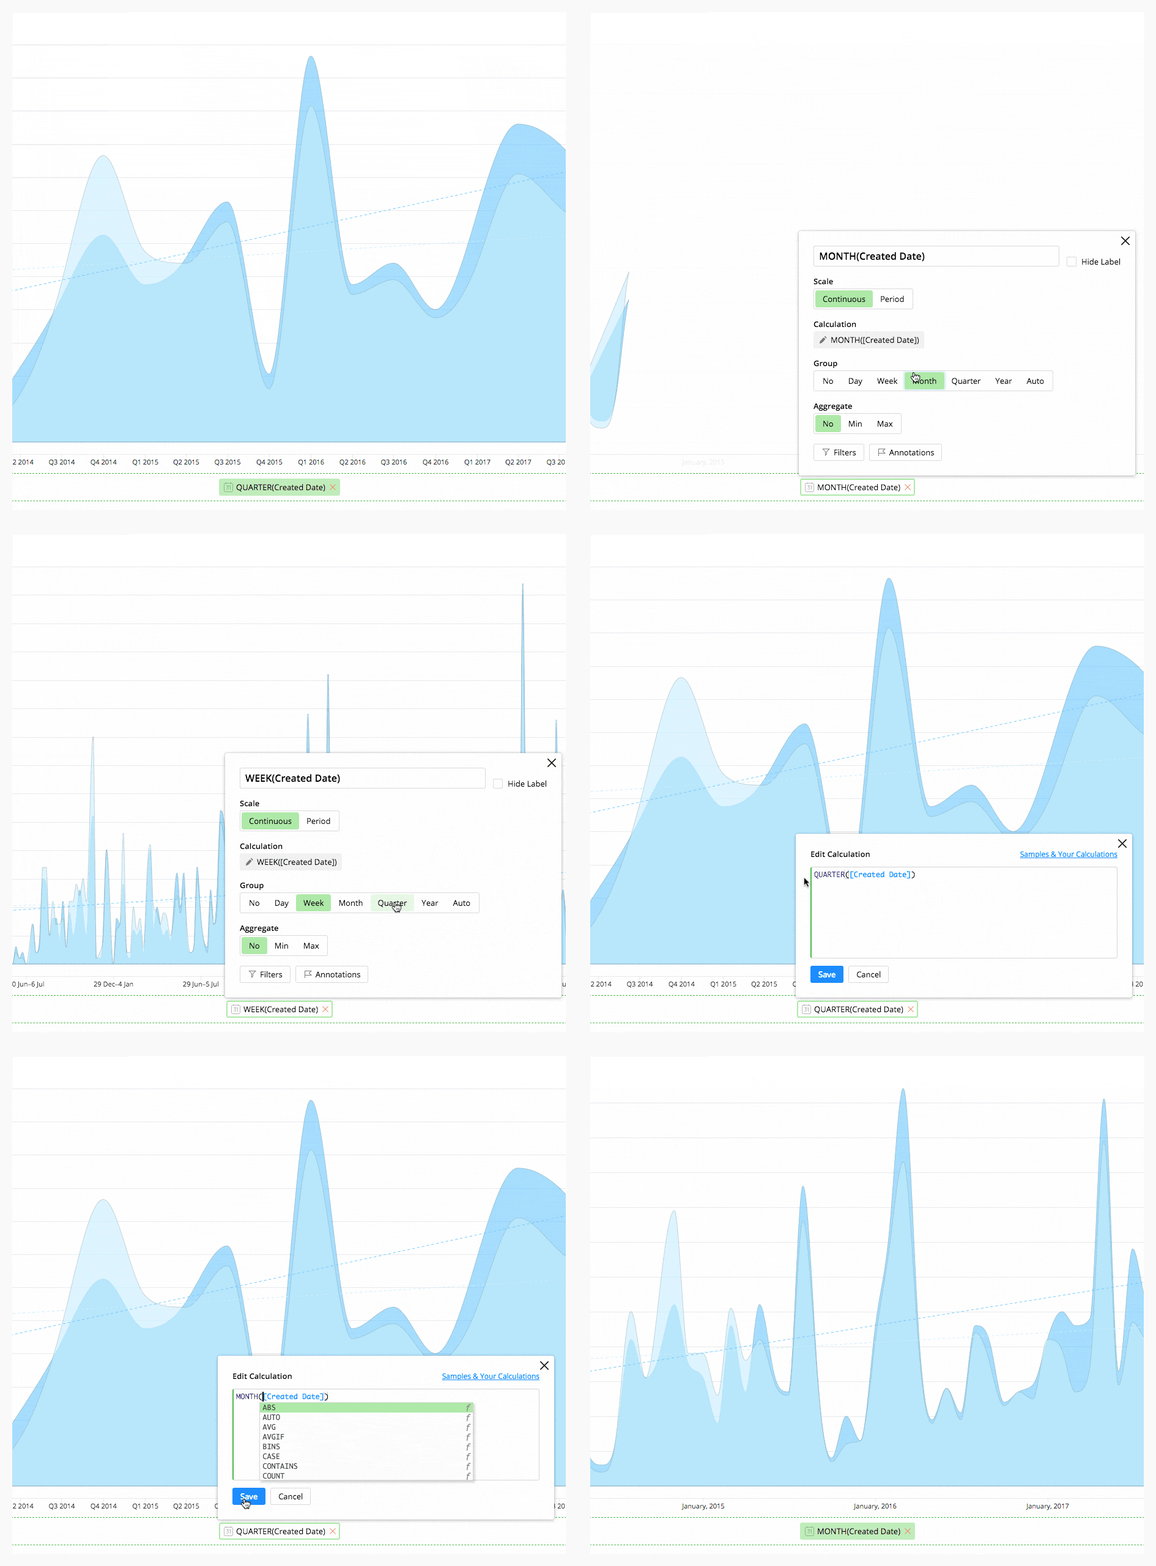
Very often, data needs to be aggregated by specific time periods, such as months or quarters. For example, when you need to see how many cards were created during a month (as shown on the chart above). We support the following grouping periods for dates: DAY, WEEK, MONTH, QUARTER and YEAR. There is also a magic AUTO option, which allows us to peek the most suitable date period grouping automatically. This grouping can be selected on the UI by clicking on the corresponding option in the data section of the dimension popup. It can also be provided using calculations.


